AI Ferncast Listener Growth Chart Infographic
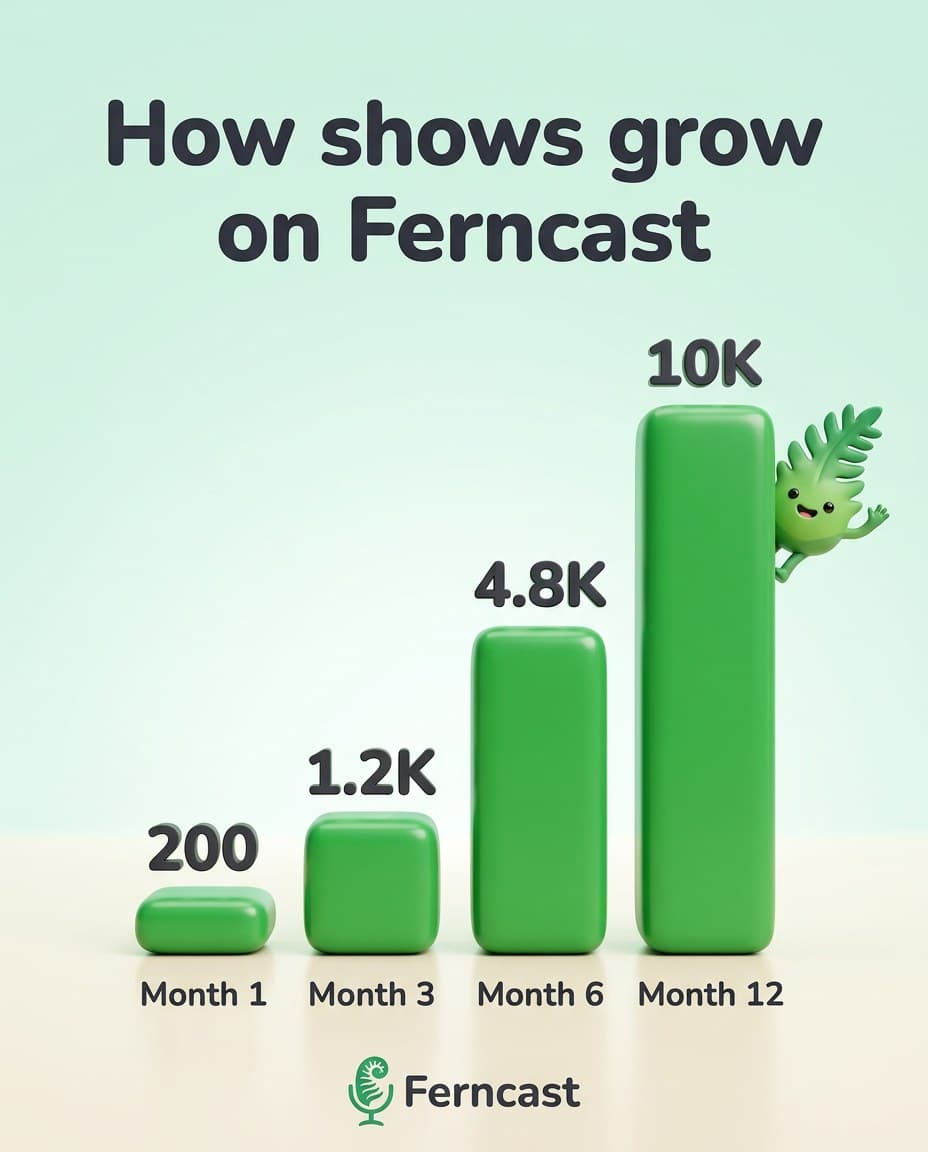
See an AI-generated Ferncast bar chart infographic, "How shows grow on Ferncast", with four labelled months and values from 200 to 10K, made with Nano Banana 2.1 from a single brand reference image.
Example breakdown
Why it stays on-brand
The 3D bars use the brand's fern green on mint, the title uses the rounded sans-serif, and Fernie climbs the tallest bar.
Marketing use
Use it as a stats post, a slide in a pitch deck, or a graphic for a case study or growth report.
Prompt
Premium 3D infographic for Ferncast, styled like an Apple keynote slide. Soft mint gradient backdrop with subtle depth. Four glossy fern-green 3D bars rising left to right on a cream floor, soft reflections and contact shadows, labelled "Month 1", "Month 3", "Month 6", "Month 12", with crisp values floating above each: "200", "1.2K", "4.8K", "10K". Fernie the mascot from the brand image climbing the tallest bar, waving. Bold rounded title at top: "How shows grow on Ferncast". Studio lighting, shallow depth of field, Ferncast logo small at the bottom. All text sharp and correctly spelled. No other text.
How this was generated
Brand DNA came from your reference visual. That DNA was applied as rules on top of the prompt used for this asset (shown in the Prompt section above).